Quickstart
thatDot Novelty streams categorical data and instantly highlights anomalies with explanations. This short guide will show you how to start a trial version of Novelty, stream Categorical Data into it, and analyze the observation results that are streamed out.
Before You Begin
Running the trial version of Novelty requires an API Key. To get an API Key, you can follow these instructions for detailed steps on where to fill out a form to receive a key, how to configure Novelty, and how to run an instance. The summary of it is this:
- Fill out Free Trial Form and Receive API Key
- Download Novelty Free Trial
- Configure and run Novelty
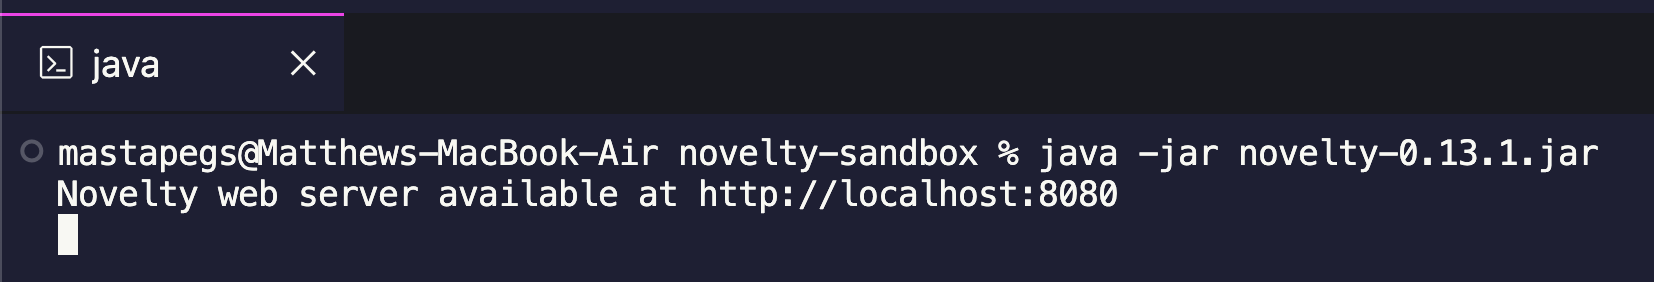
Starting the thatDot Novelty instance should output some trial license information and should show that the Novelty web server is ready to serve requests at localhost:8080
It may also help to read Novelty's Core Concepts before starting.
Sample Data Download for Quickstart
You can download some sample data to ingest into Novelty here. This CSV file contains data from the VAST Insider Threat Challenge. Here is a sample line from the file:
prox-in-building, 37.170.100.38, 80, 37.170.100.200
This record represents the following Categorical data:
Prox Building Status, Source IP, Port, and Destination IP
We will use this file in this Quickstart.
How to Stream Data Into Novelty
There are 2 ways to stream Categorical Data into Novelty:
- The Upload UI: Great for uploading a batch of data from a file
- The REST API: Great for production, ingesting data from any supported input stream
Stream Data using the Upload UI
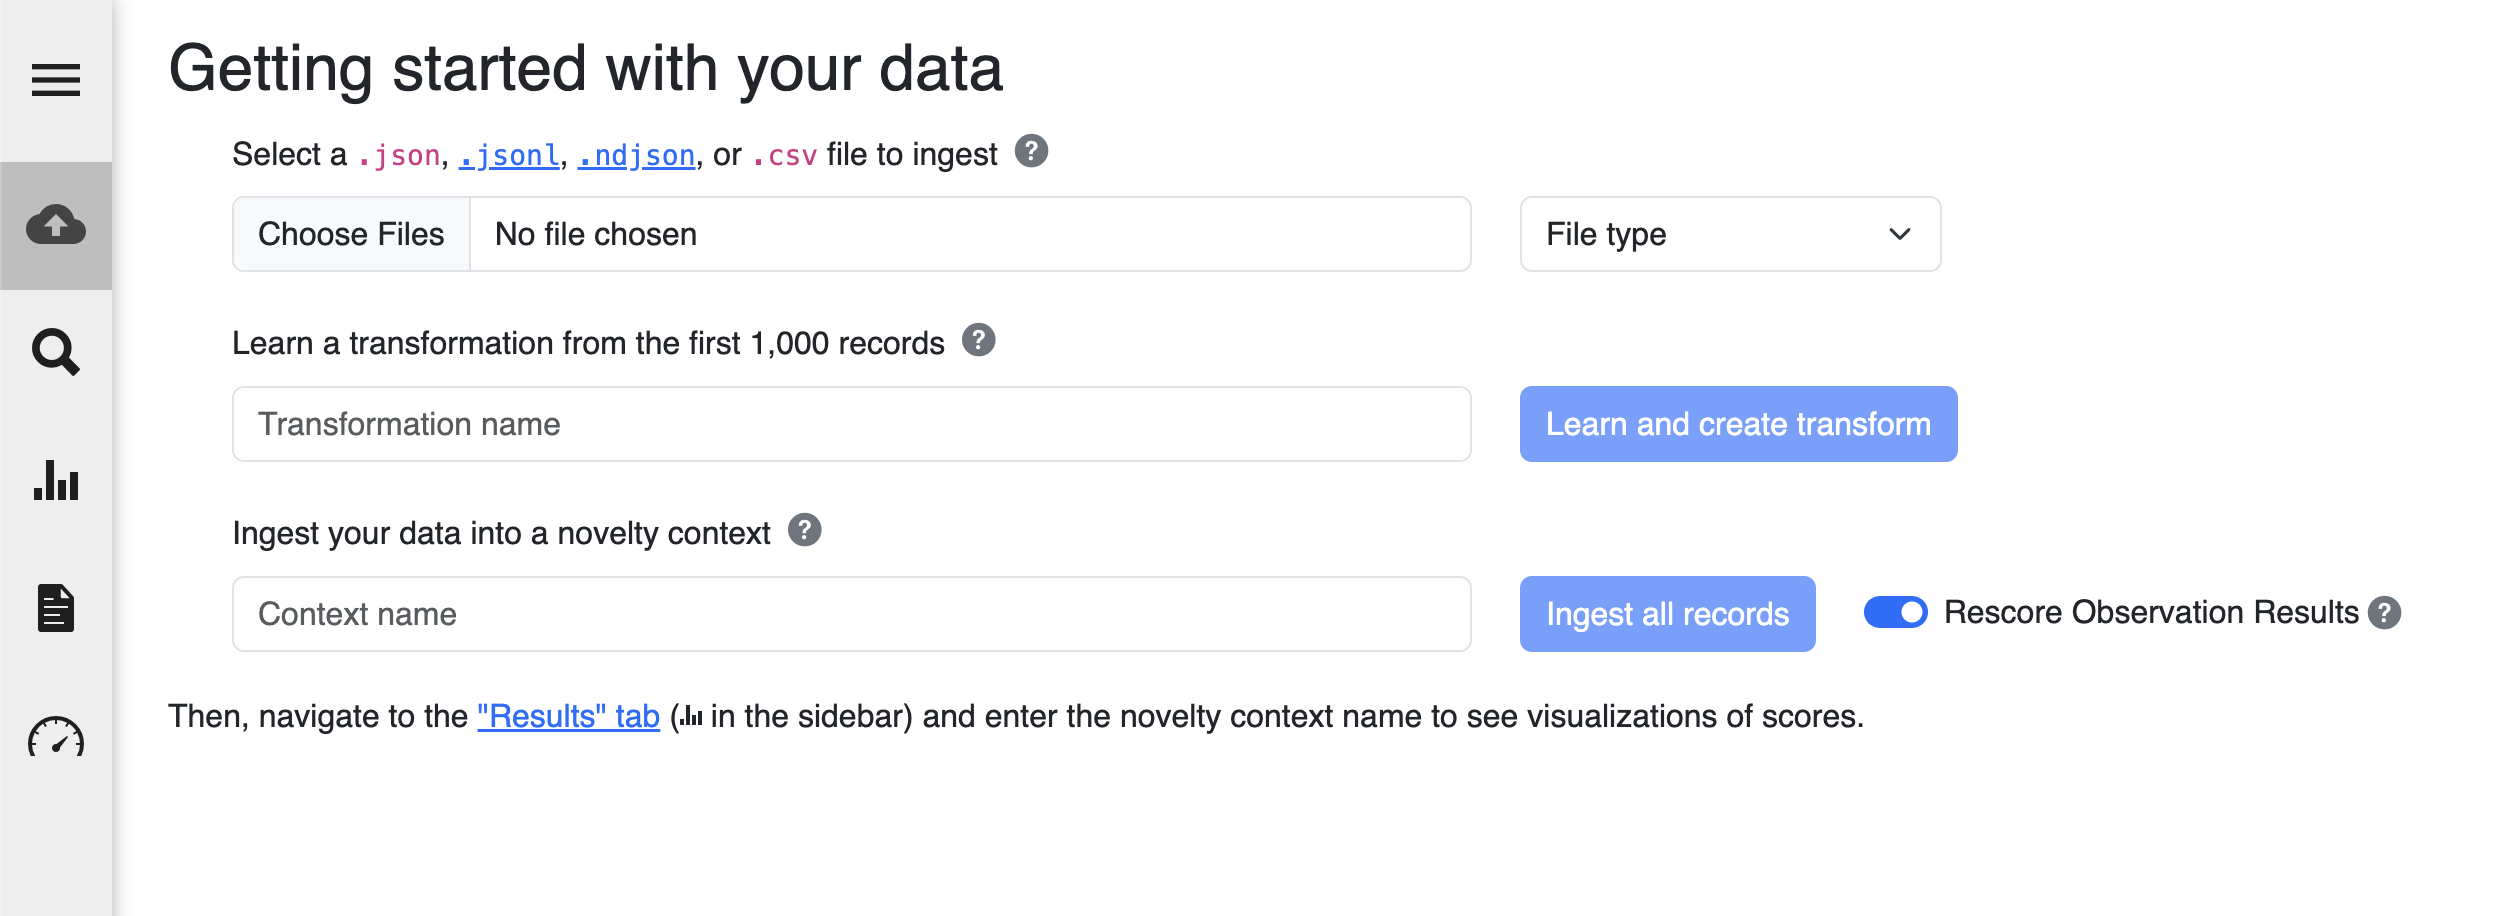
The Upload Page allows you to find novel data in 3 easy steps:
- Upload a File
- Create a Transformation
- Stream Observations into Novelty
Upload a File
A file of various different formats can be ingested:
- CSV
- JSON
- JSONL
- NDJSON
- Plain Text
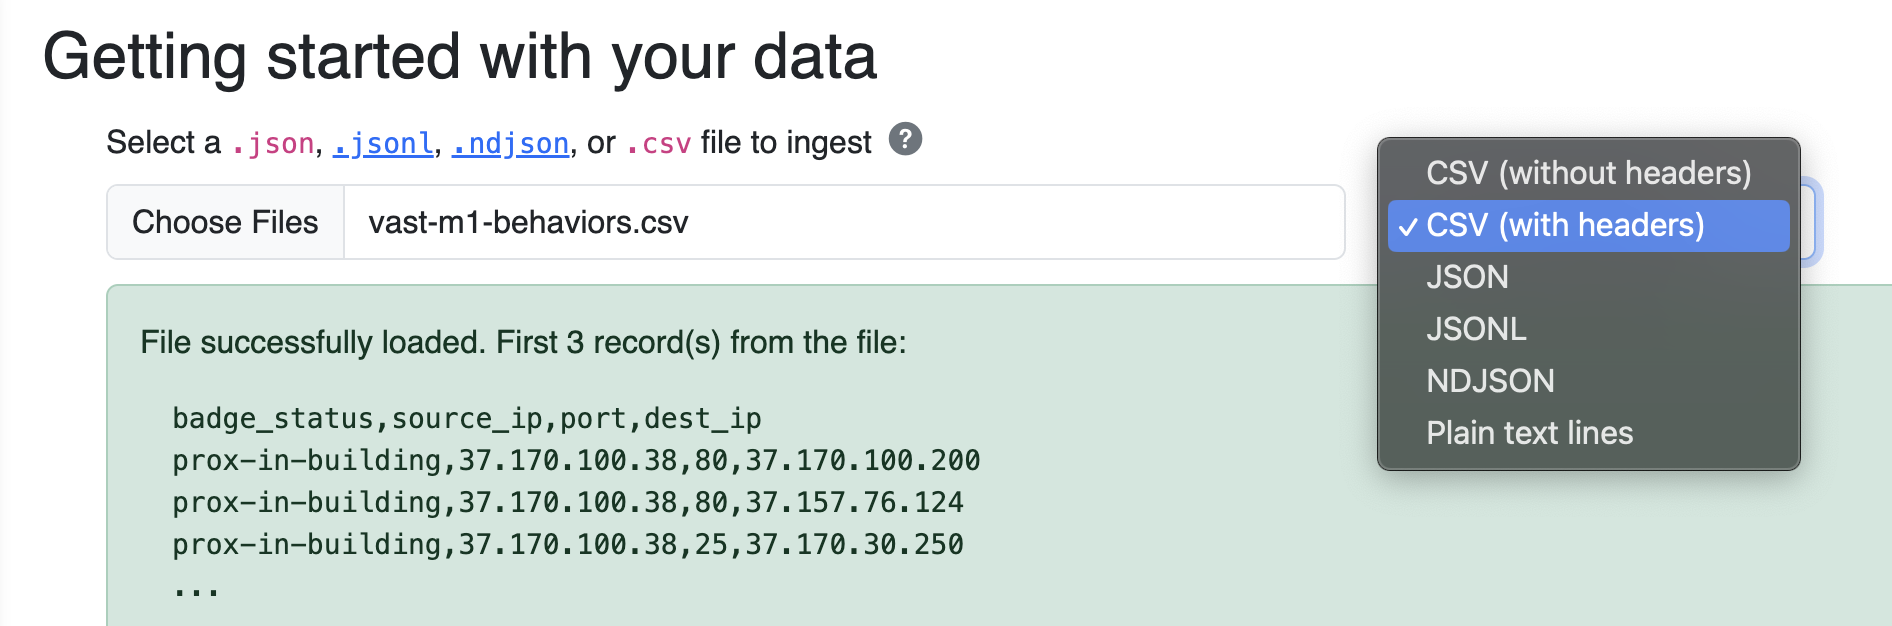
Click the Choose Files button and select the downloaded vast-m1-behaviors.csv file. Since this CSV file has headers, make sure to select the CSV (with headers) file type to ensure Novelty doesn't create Observation Results from the header record.
Creating a Transformation
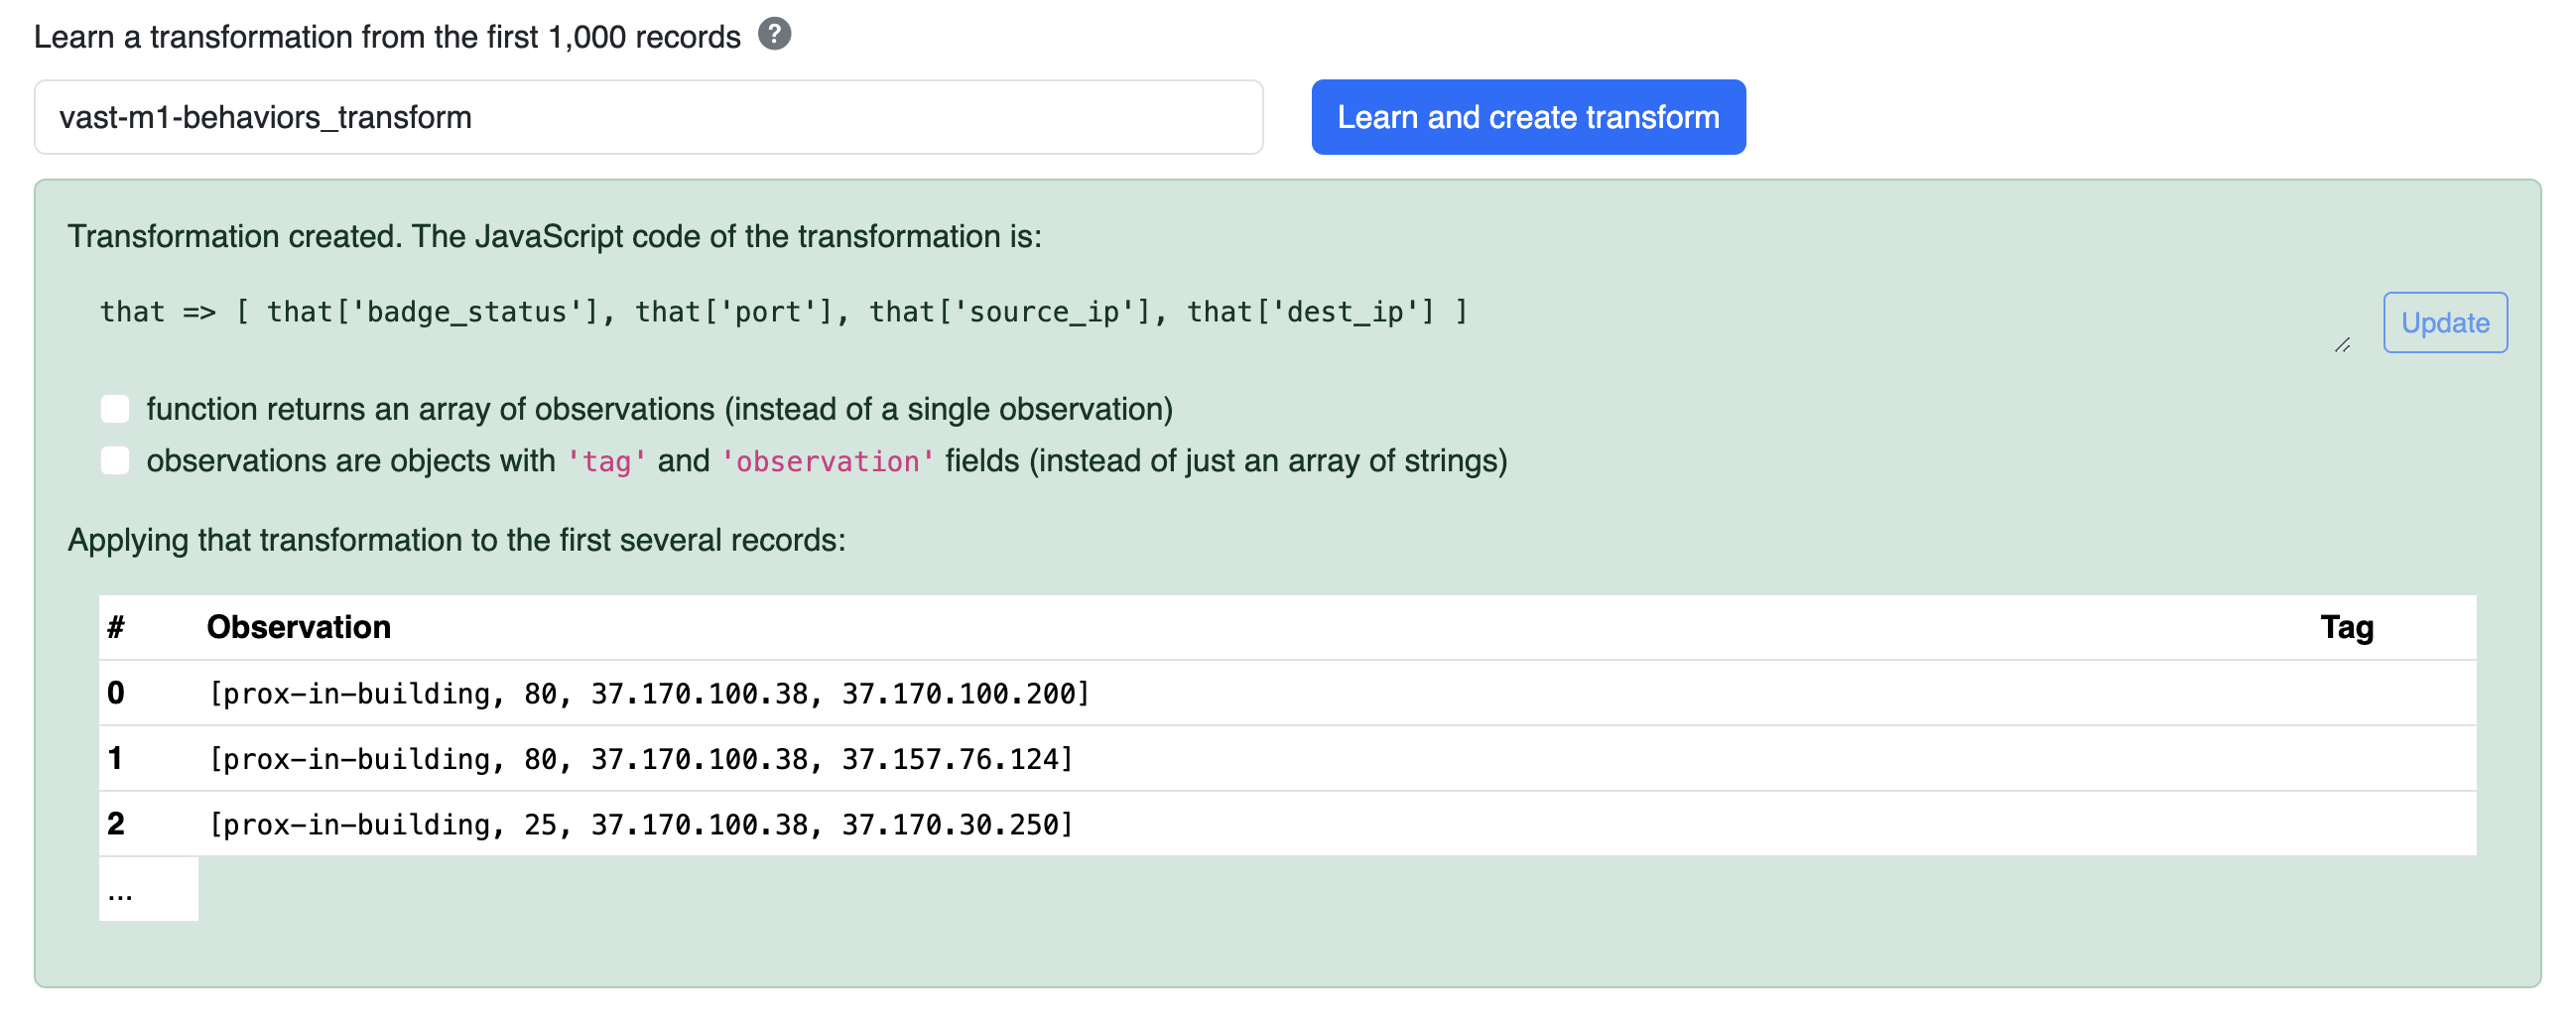
After choosing a file and selecting its File Type, the Learn and create transform button will be enabled. Click it to have Novelty attempt to automatically create a transformation.
Note
- Transformation: A transformation is a JavaScript function that is responsible for converting each record in the chosen file into an Observation.
- Observation: An element that is streamed into Novelty. It is a list of Observation Components.
- Observation Component: A string containing a piece of Categorical Data.
For this VAST Insider Threat dataset, the following transformation is automatically created:
that => [
  that['badge_status'],
  that['port'],
  that['source_ip'],
  that['dest_ip']
]
Each record is represented by the that variable. This JavaScript function accepts a that parameter and returns an Observation, which is an Array of Observation Components. The transformation can be editted, and this is your opportunity to change the order of Observation Components, or to convert/bin Numerical Data into Catagorical Data.
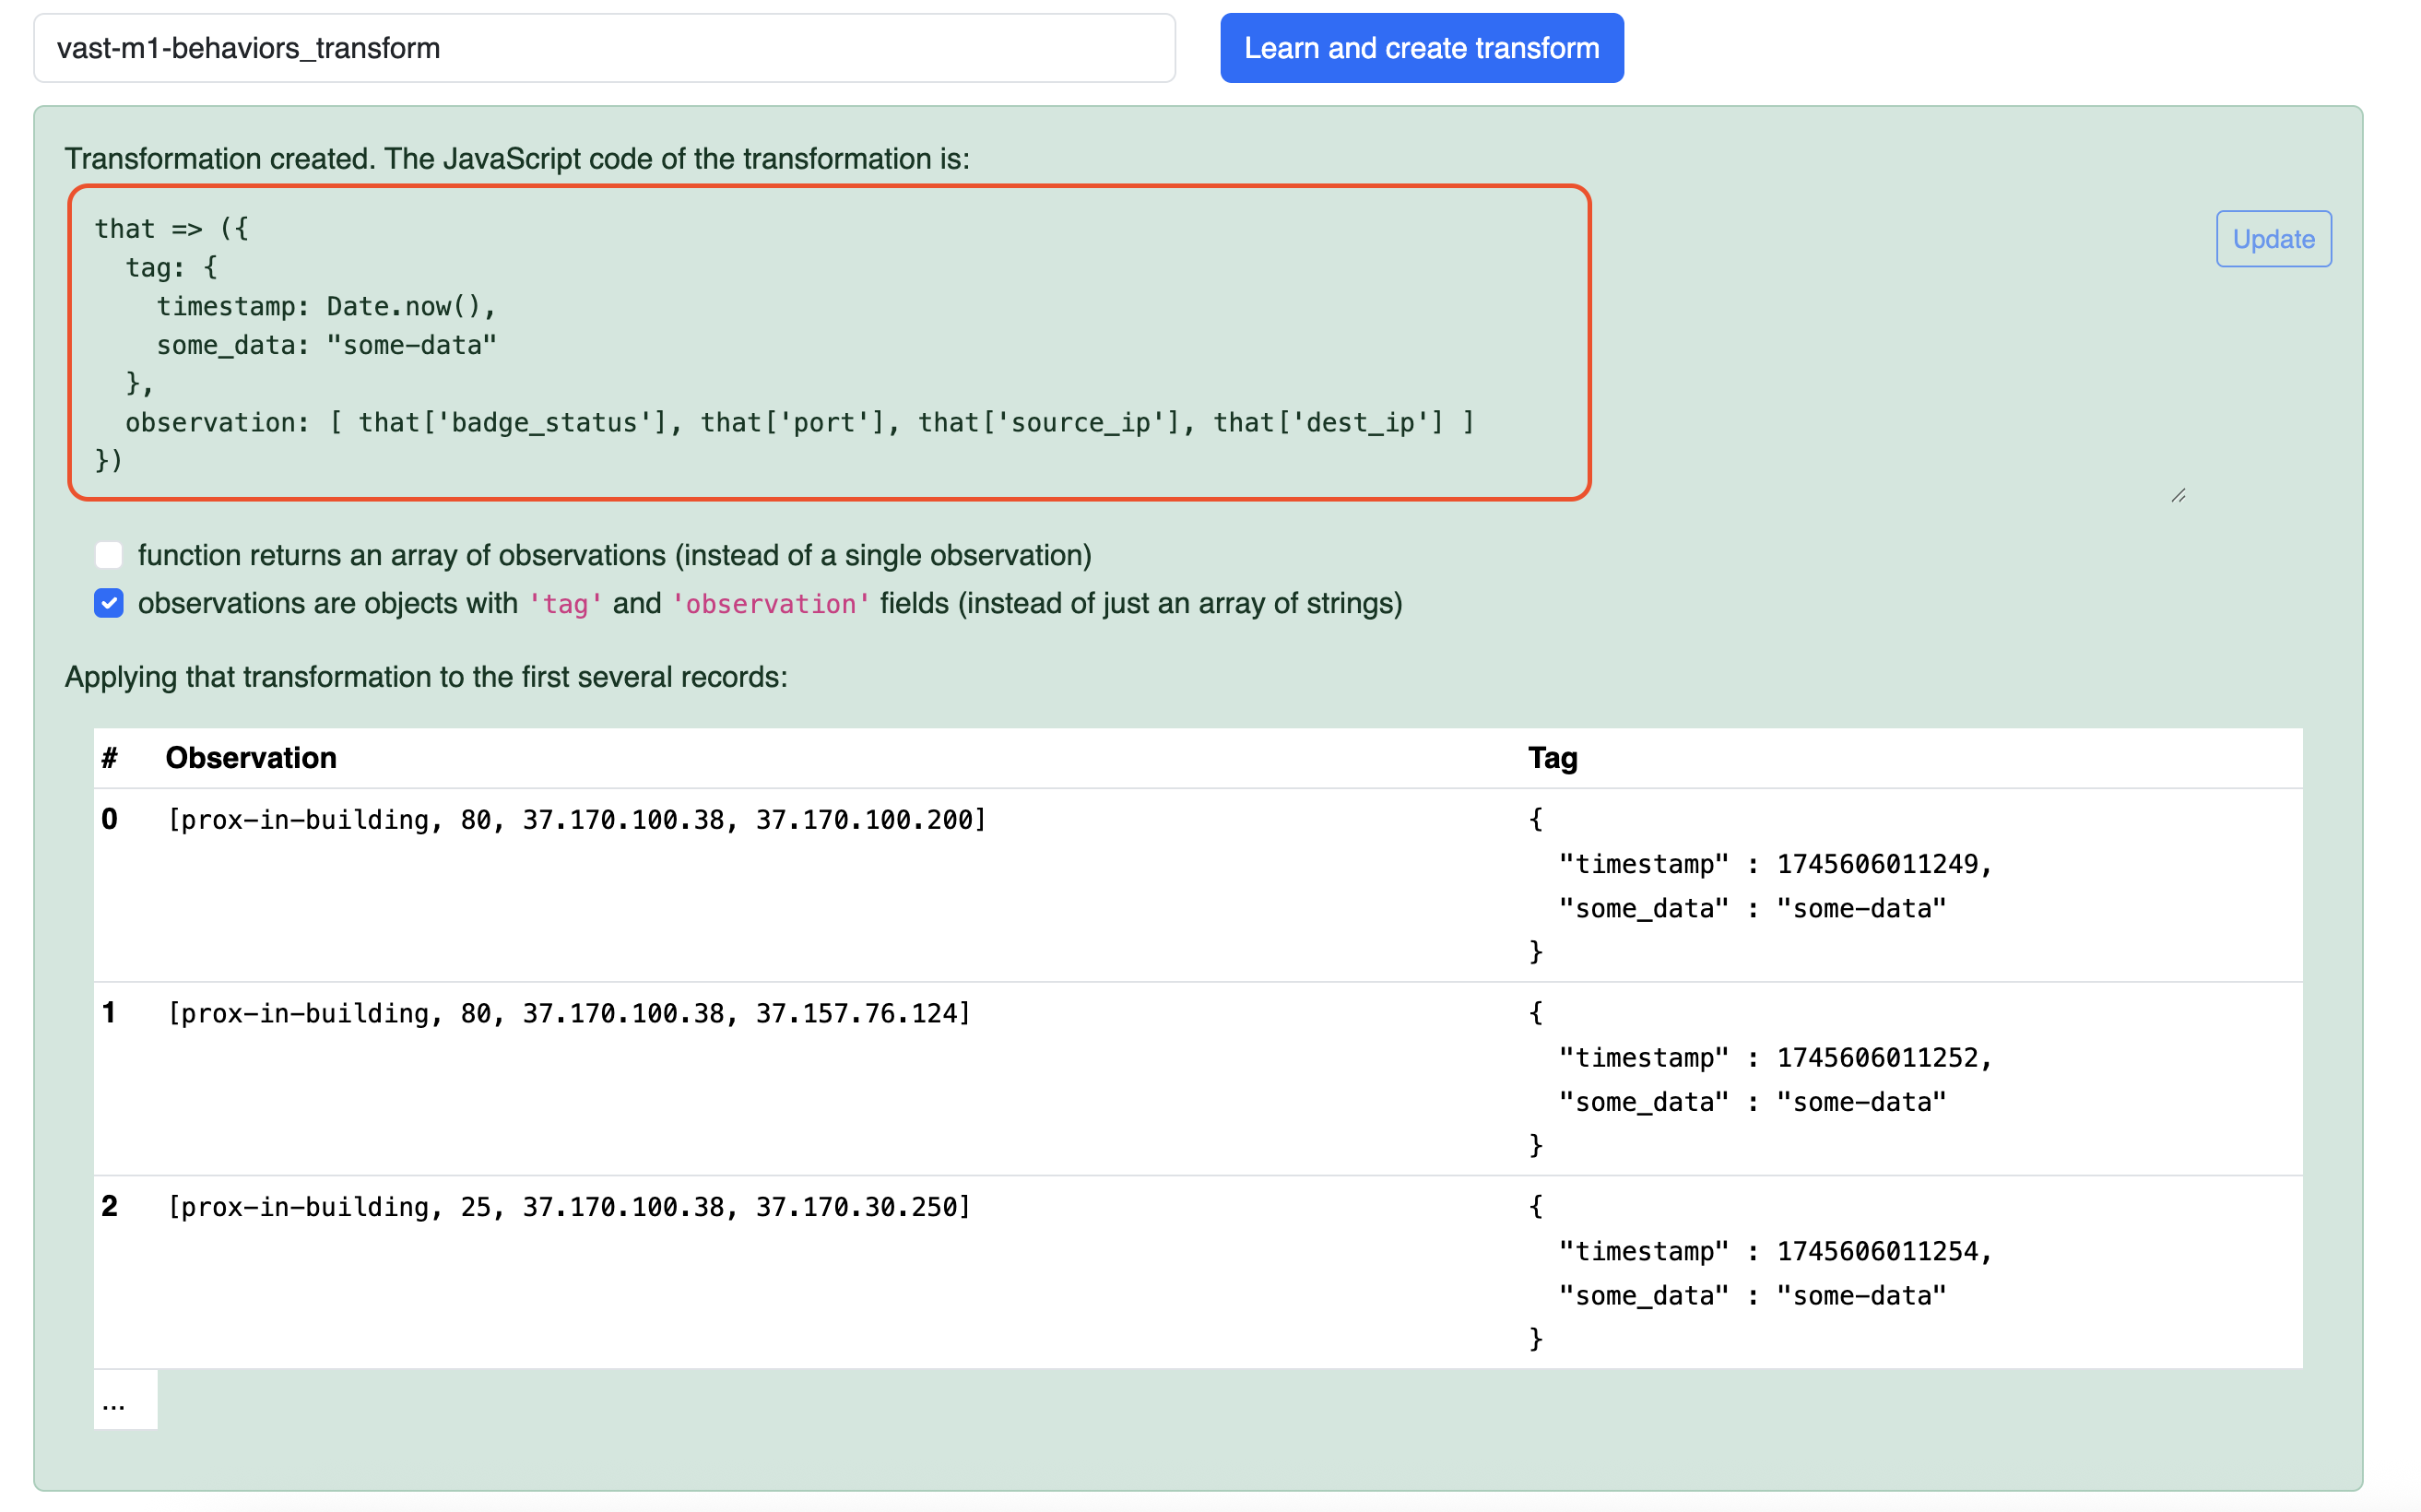
(Optional) Adding a tag to every observation
If you'd like to associate some information with each observation sent to Novelty, instead of creating a transformation that emits an array of strings, instead, create a transformation that returns an object with a tag and an observation property. That observation property represents the array of strings, and the tag can be any data that you'd like to associate with the observation. The observation's score is not derived from the tag.
that => ({
  tag: {
    timestamp: Date.now(),
    some_data: "some-data"
  },
  observation: [ that['badge_status'], that['port'], that['source_ip'], that['dest_ip'] ]
})
Ingest Records
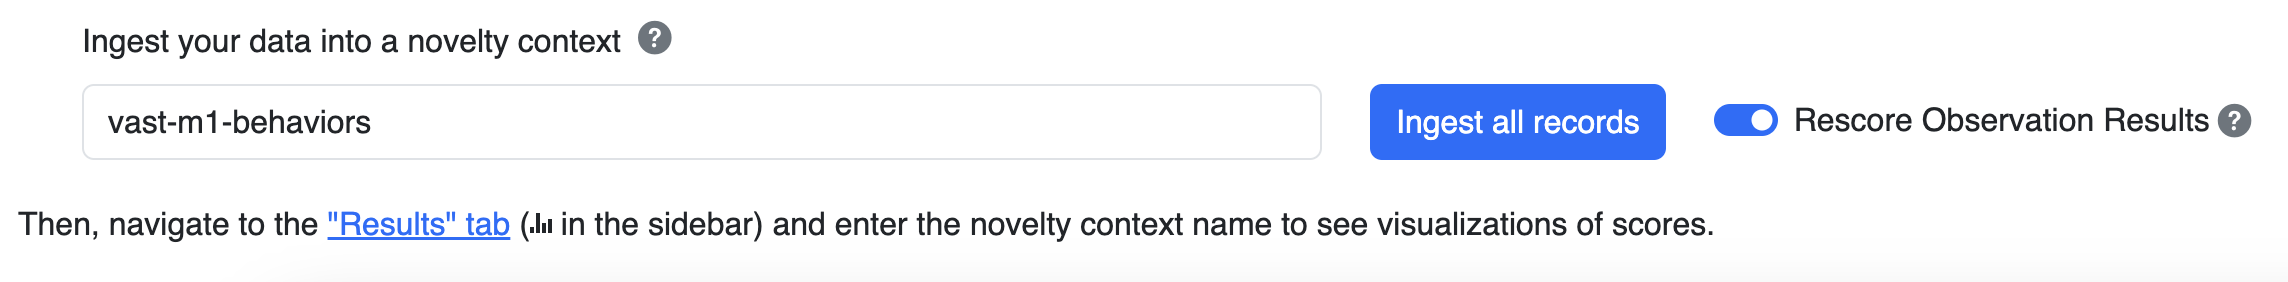
After creating a transformation, 3 controls are enabled:
- Context input: A group of observations. Each observation in the same context should have the same structure. Each context is entirely separate from the others.
- Rescore Observation Results toggle: Since data uploaded into Novelty though the Upload UI is a batch of data, Observations can be scored in batch mode.
- In streaming mode, each observation is scored based on the context of observations that came before it.
- In batch mode, each observation is scored based on the context of every observation in the batch.
- Ingest all Records button: This will initiate the streaming ingest of records via WebSocket.
If the Rescore toggle is disabled, then Novelty will only provide streaming scores of observations. If the Rescore toggle is enabled, then after the streaming scores are completed and there are no more records in the batch, Novelty will rescore each observation, and provide batch observation results.
Viewing the Observations Results
After initiating an ingest, you can view the results in the Results tab.
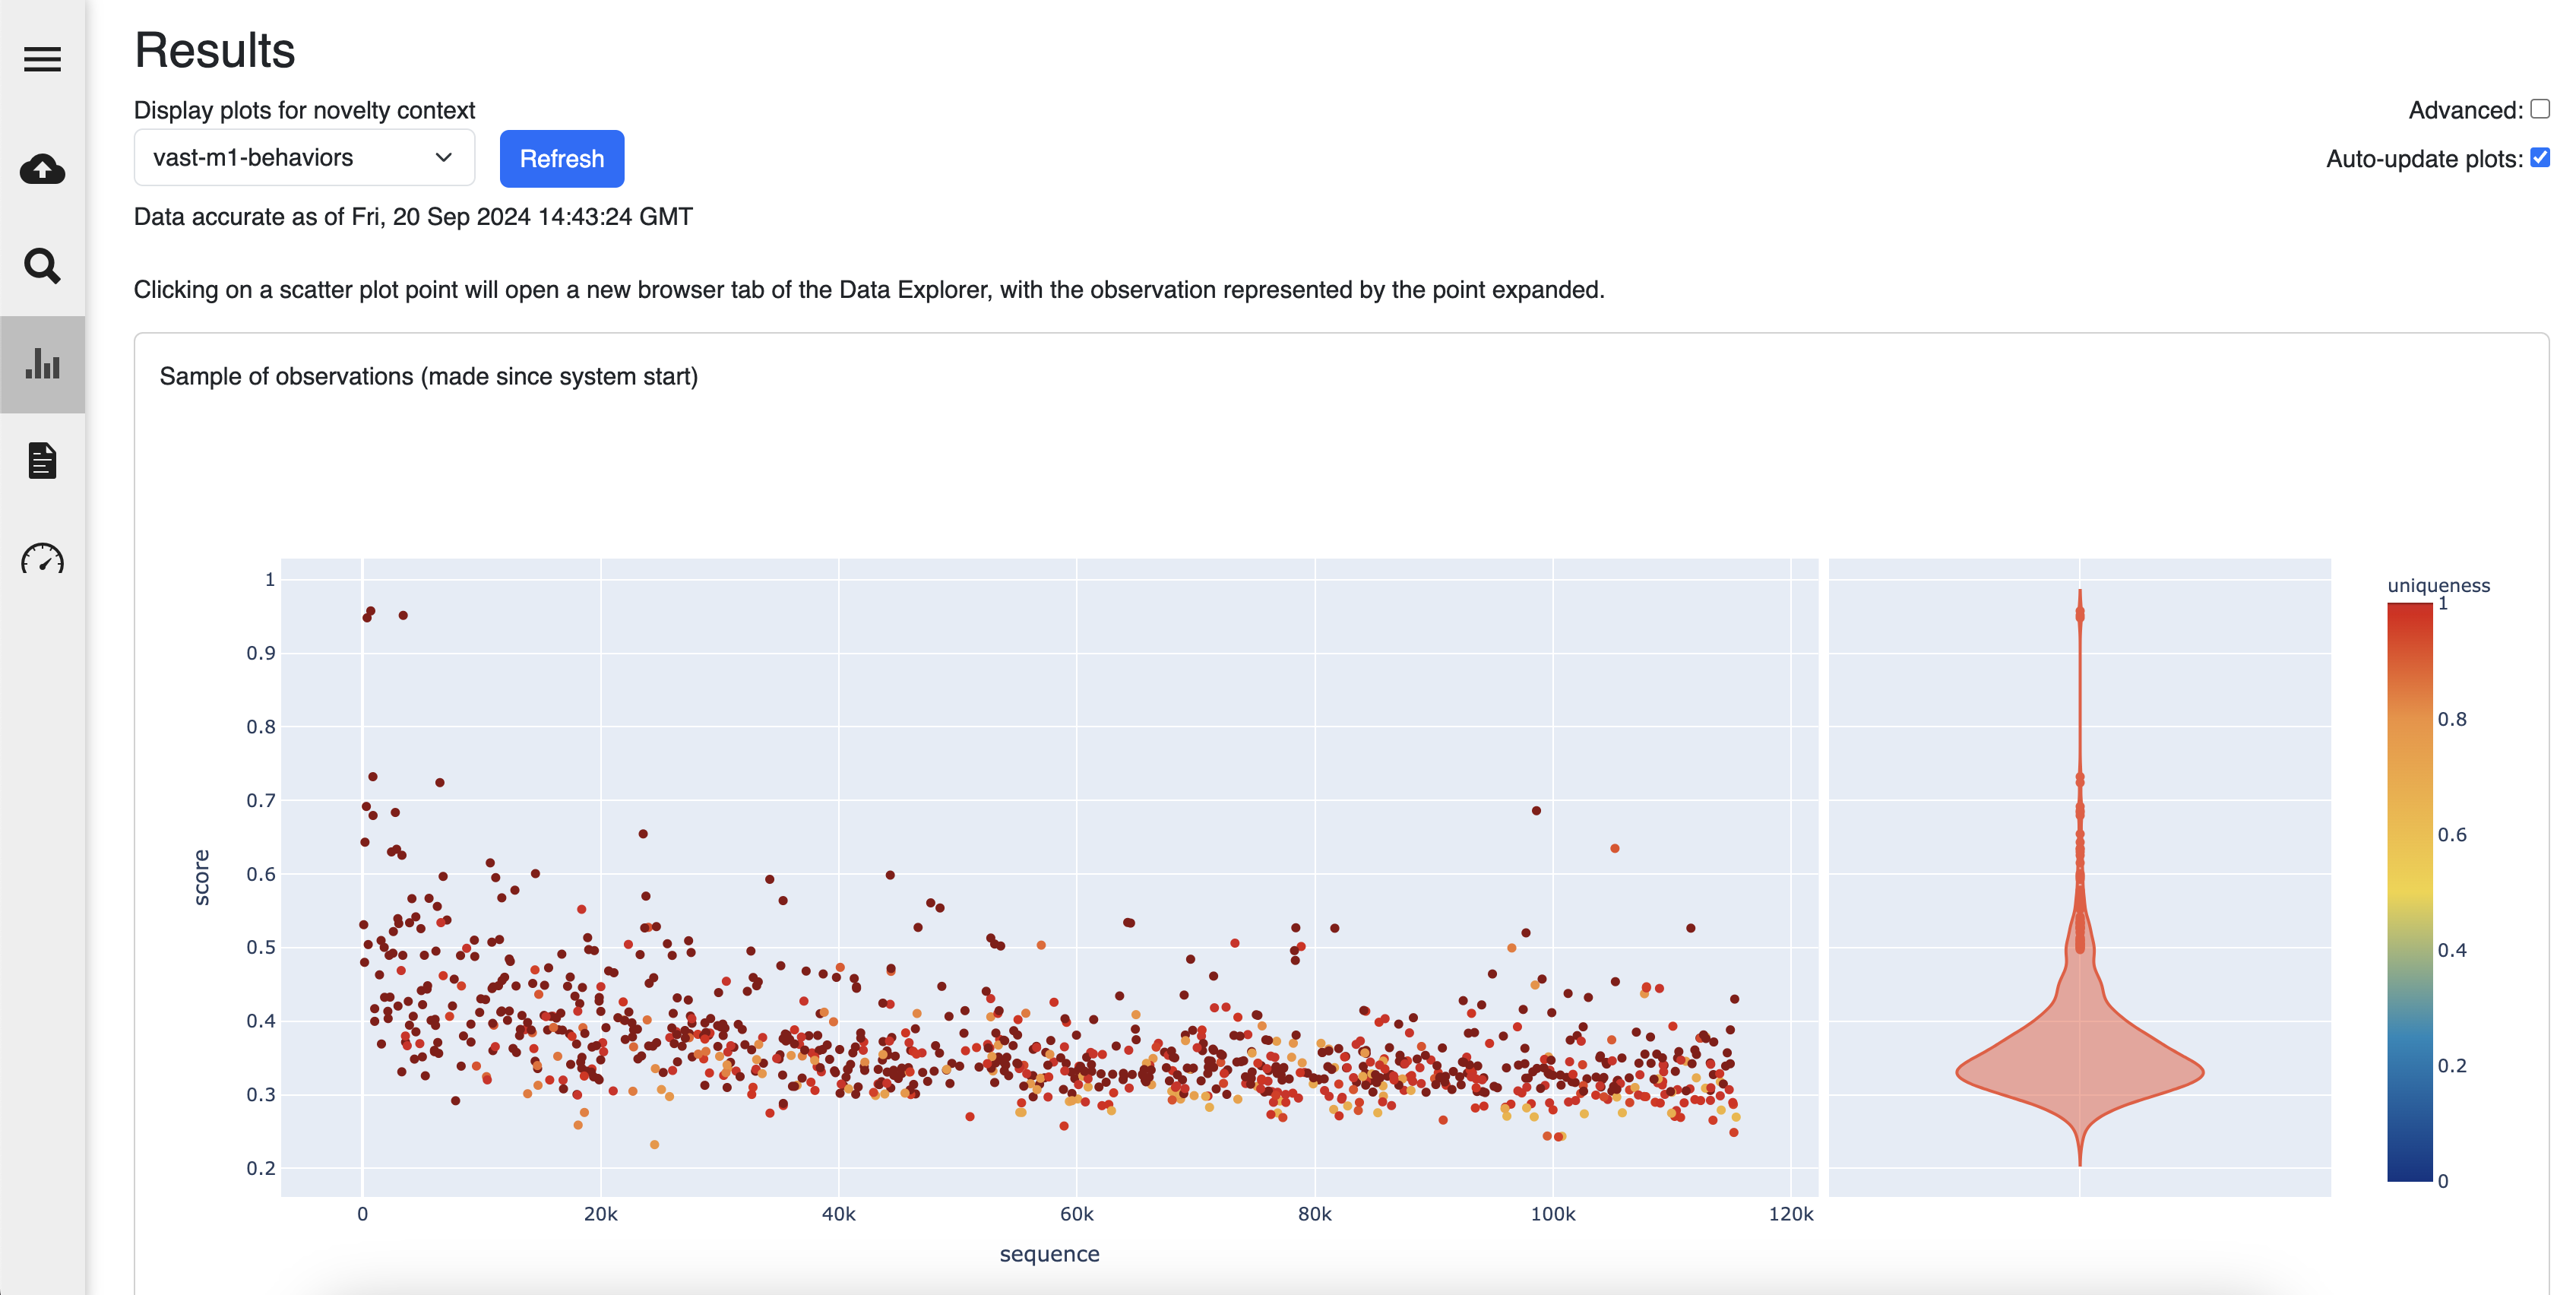
There are 4 plots on the Results tab. The first 3 plots demonstrate what happens when streaming observations into Novelty. They update automatically as data is streaming in. The 4th plot demonstrates what happens when ingesting a batch of data with the Rescore toggle enabled. It will wait until all data has been ingested, and then reprocessed, so that all scores are based on all observations. Only if the data is rescored will the plot display the results.
- Streaming Plot - Sample of Observation Results
- Streaming Plot - Most recently scored Observation Results
- Streaming Plot - Highest Scoring Observation Results
- Batch Plot - Highest Scoring Observation Results
Each plot will render Observation Results, and if you hover over them, you can see the full data payload of an Observation Result
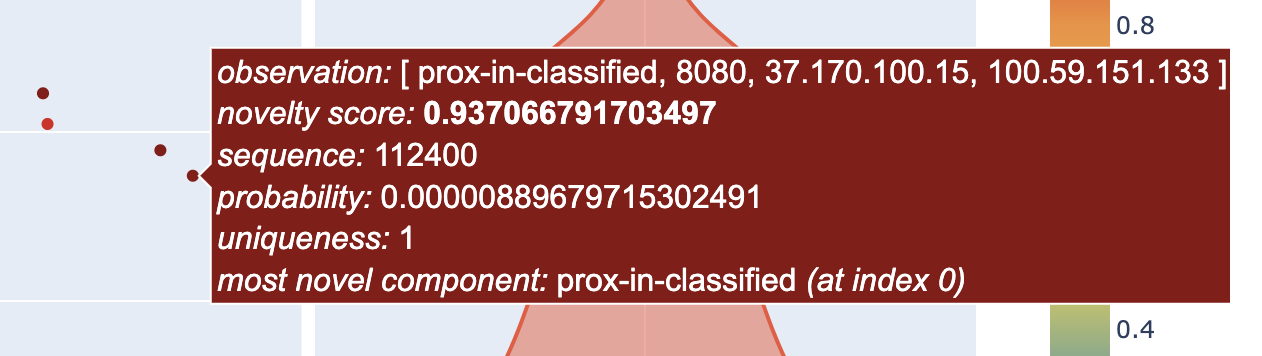
Note
An interesting piece of data in the Observation Result is the Most Novel Component, which tells you which Observation Component was the most anomalous piece of categorical data in the Observation.
Stream Data using the REST API
Novelty's REST API provides a more flexible interface for scoring observations from different input streams.
To mirror the Upload UI, we will use the same dataset (VAST Insider Threat), from the same source (Local File), using the same transformation. In a production situation, the Kafka and WebSocket sources would enable Novelty to consume from a potentially infinite stream.
Rapid REST API testing with provided .rest file
We've created a short .rest file that can be used with VSCode's REST Client plugin or IntelliJ's HTTP Client to rapidly try out the following REST API calls. Use it as a point-and-click alternative to cURL.
Create Transformation
A transformation needs to be created, which will convert each record being streamed in, to an Observation. You can use the PUT /api/v1/novelty/transforms/{transformation} endpoint to create a transformation. It accepts a transformation query parameter, used to name the transformation.
PUT /api/v1/novelty/transforms/{transformation}
{
  "function": "that => [that['badge_status'], that['port'], that['source_ip'], that['dest_ip']]",
  "type": "JavaScript"
}
Note
If you are tagging your observations, it is important to set the recordFormat property in the transformation create endpoint to Tagged to ensure that Novelty expects the transformation to be in the form of an object with tag and observation properties.
function: |
  that => ({
    tag: {
      timestamp: Date.now(),
      some_data: "some-data"
    },
    observation: [ that['badge_status'], that['port'], that['source_ip'], that['dest_ip'] ]
  })
type: JavaScript
recordFormat: Tagged
Stream File into Novelty
After creating a transformation, it can be used as part of the request to stream data in from a local file. You can use the POST /api/v1/novelty/stream/{name} endpoint to create a new stream. It accepts a name query parameter, used to name the stream. In the following example, we are using the vast named transformation, created in the prior step.
POST /api/v1/novelty/stream/{name}
{
  "noveltyContext": "vast-m1-behaviors",
  "transformation": "vast",
  "inputStream": {
    "filePath": "/Users/novelty-user/vast-m1-behaviors.csv",
    "type": "FileInput",
    "fileType": "CsvWithHeaders"
  },
  "outputStream": {
    "type": "Drop"
  },
  "failureMode": "LogAndKeepConsuming"
}
In this example, the Drop output stream was set, but other output streams can be configured:
- Drop: Ignores all results without further processing
- FileOutput: Writes all scoring results to a file.
- KafkaOutput: Writes all scoring results to a kafka topic.
- SlackNotification: Periodic Slack notifications via webhook
Even though the REST API was used to stream data in, the observation result plots in the UI will still populate with data. To view the results of your ingest via REST API, go to the /plots route to view the observation results (same as you did when uploading data via the UI).
Next Steps
Now that you've gotten a feel for scoring categorical data using Novelty, check out these other resources to continue exploring anomaly detection using Novelty.
- Novelty Demo with Jupyter Notebook, which interacts with Novelty via REST API, using it as a scoring engine
- Novelty VAST Insider Threat Blog Demo
- Using Streaming Graph with Novelty for anomaly detection using data from multiple sources